Python for Data Science uses below libraries. We have discussed each Library with related contents to expand further.
However it is imperative to be well versed with basics of Statistics- specially Regression Analysis- to understand the below libraries and Data Science properly. These have been taken up in a separate module.
Numpy
NumPy is a library for the Python programming language, adding support for large, multi-dimensional arrays and matrices, along with a large collection of high-level mathematical functions to operate on these arrays.
Learn numphy
Pandas
pandas is a fast, powerful, flexible and easy to use open source data analysis and manipulation tool, built on top of the Python programming language.
Learn Pandas
Matplotlib
Matplotlib is a plotting library for the Python programming language and its numerical mathematics extension NumPy. It provides an object-oriented API for embedding plots into applications using general-purpose GUI toolkits
Check few Resources to learn matplotlib
Pyplot
matplotlib.pyplot is a collection of command style functions that make matplotlib work like MATLAB. Each pyplot function makes some change to a figure: e.g., creates a figure, creates a plotting area in a figure, plots some lines in a plotting area, decorates the plot with labels, etc.
In matplotlib.pyplot various states are preserved across function calls, so that it keeps track of things like the current figure and plotting area, and the plotting functions are directed to the current axes
Statsmodels
statsmodels is a Python module that provides classes and functions for the estimation of many different statistical models, as well as for conducting statistical tests, and statistical data exploration. An extensive list of result statistics are available for each estimator. The results are tested against existing statistical packages to ensure that they are correct.
Learn Statsmodels
- https://www.statsmodels.org/stable/index.html
- https://pypi.org/project/statsmodels/
- https://github.com/statsmodels/statsmodels
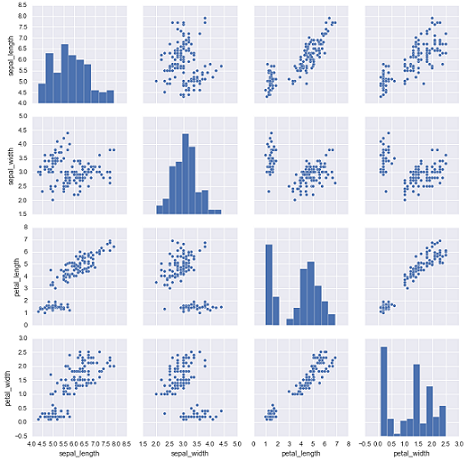
Seaborn
Seaborn is a Python data visualization library based on matplotlib. It provides a high-level interface for drawing attractive and informative statistical graphics. It is somewhat similar to matplotlib.
Seaborn and Matplotlib are two of Python’s most powerful visualization libraries. Seaborn uses fewer syntax and has stunning default themes and Matplotlib is more easily customizable through accessing the classes.
Learn Seaborn
[…] Python Basics for Data Science […]
[…] Python Basics for Data Science […]