Vision Institute of Technology, Kanpur
2015-16
- Draw the polar plot of G(S)H(S)=K/JW
- Give frequency domain specifications. Determine the expression for resonant
- peak and resonant frequency for a 2nd order system.
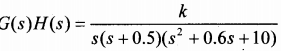
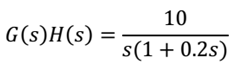
- Discuss the nyquist stability criterion in detail. Also sketch the Nyquist plot for the system with
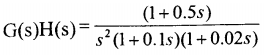
- Explain what is bode plot. Draw the bode plot of unity feedback control system having open loop transfer function
also determine GM and discuss the stability of closed loop system.
2016-17
- What is polar plot.
- Explain the co-relation between transfer function and state space technique.
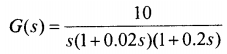
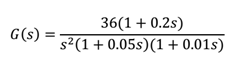
- Sketch the bode plot of the system given by
- And determine the stability of the system.
- State Nyquist stability criterion. Investigate the stability of a closed loop system with open loop transfer function given by
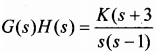
by using Nyquist plot. Also find the value of GM.
2017-18
- Plot the Bode diagram for the following transfer function and obtain the gain and phase cross over frequencies G(S) =2KS / (1+0.2S) (1+0.02S).Determine the value of K for a gain cross over frequency of 20 rad/sec
- Sketch the root locus of the system whose open loop transfer function is G(S)= K / S(S+2)(S+4).Find the value of K so that the damping ratio of the closed loop system is 0.5.
- Construct the polar plot for the function G(s)H(S) =2(S+1)/ (S+2)(S+4). find Gain cross over frequency ,Phase cross over frequency, Gain margin and Phase margin.
- Construct Nyquist plot for a feedback control system whose open loop transfer function is given by G(S)H(S) =5/ S(1-S).Comment on the stability of open loop and closed loop transfer function.
2018-19
- Establish the correlation between time response and frequency response analysis and suitably explain with diag
- For the open loop transfer function
Design a suitable compensator such that the system will have a phase margin of at least 45°.
- Draw the Bode plot for the transfer function
From the bode plot determine:
(i) Phase crossover frequency.
(ii) Gain crossover frequency
(iii) Gain Margin
(iv) Phase Margin